Our World in Data @OurWorldInData
Our World in Data is a free, nonprofit website with a mission to increase understanding of the world’s largest problems and drive informed action to solve them. ourworldindata.org Oxford, England Joined April 2015-
Tweets3K
-
Followers308K
-
Following21
-
Likes472
Read more in Hannah's recent article on this topic, with breakdowns by region: ourworldindata.org/what-has-drive… Other sources & data: nature.com/articles/s4301… ourworldindata.org/grapher/driver…
Beef production has been the largest driver of deforestation this century. Over the last two decades, around 128 million hectares of forest have been cleared to make way for agriculture and forest plantations. That’s an area five times the size of the United Kingdom. What has driven this deforestation? A recent paper estimated the contribution of different agricultural products over the last few decades. In the chart, you can see the breakdown. Beef production has been the largest driver by far, contributing over 40% of the total. This has mostly been the clearing of forest for grazing pasture, especially across Brazil and other countries in Latin America. Oilseeds — mostly soy and oil palm — were the second-largest driver, again concentrated in Latin America for soy and in Indonesia and Malaysia for palm oil. While deforestation for palm oil was high in the early 2000s and 2010s, it has fallen a lot in recent years. Forest plantations have been a large driver of deforestation in North America and East Asia. Deforestation for most other products — including cereals, roots and tubers, and cash crops like cocoa and coffee — has been concentrated in Africa, where yields have not grown quickly enough to offset rising demand. (written by @_HannahRitchie)

Read the article by @_HannahRitchie: ourworldindata.org/wild-mammal-de…
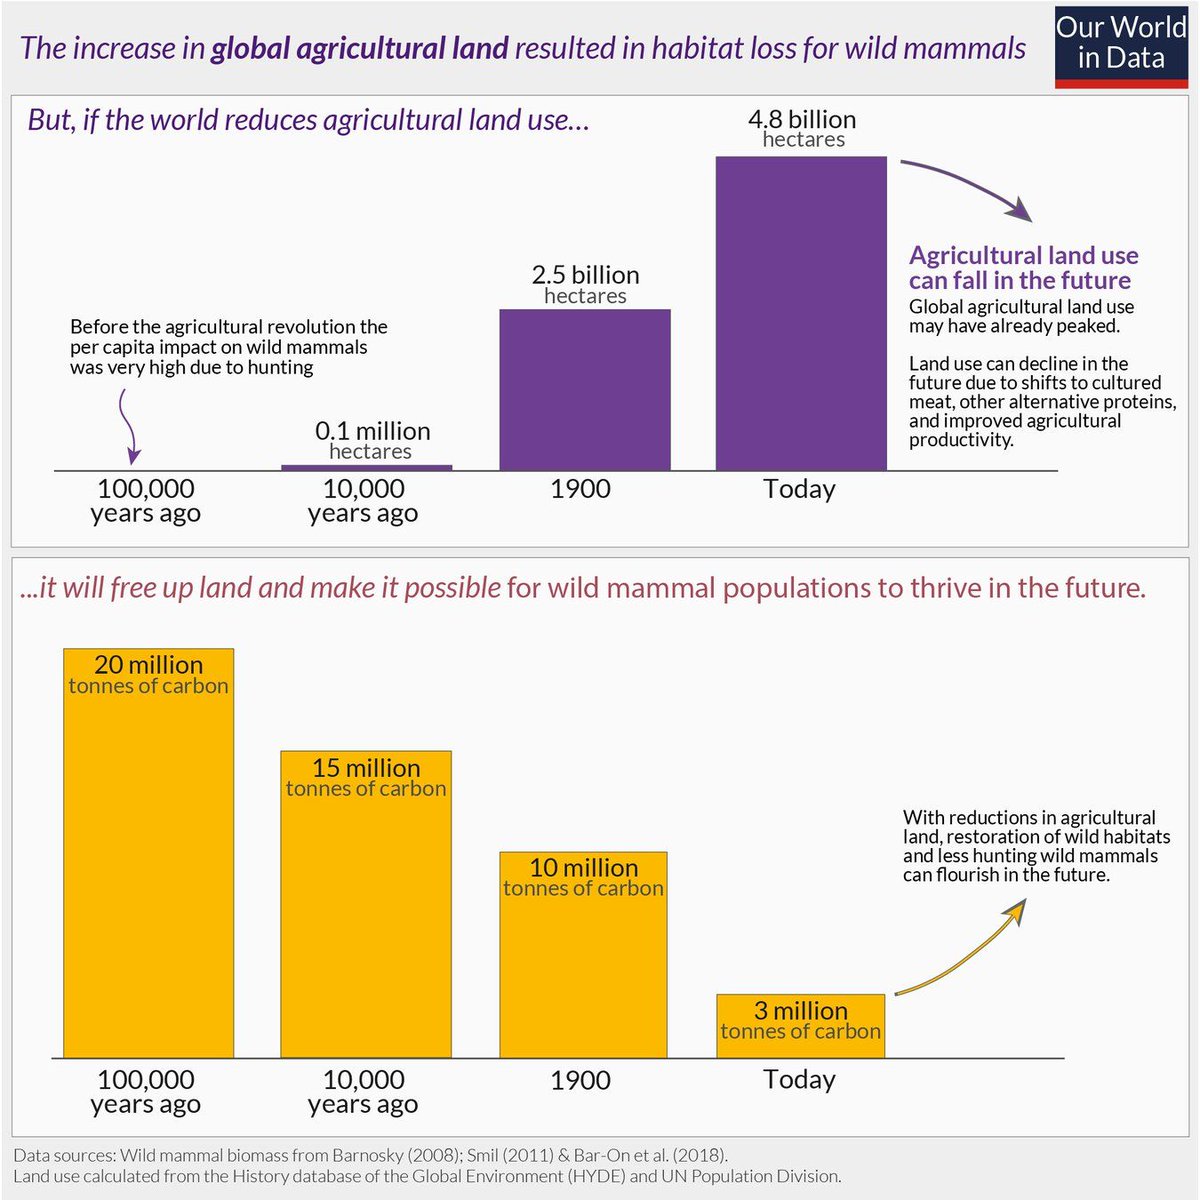
Since the rise of humans, wild land mammal biomass has declined by 85%. Around 100,000 years ago, all of the wild land mammals on Earth summed up to around 20 million tonnes of carbon. By around 10,000 years ago, there had been a huge decline, likely in the range of 25% to 50%. It was almost exclusively the world’s largest mammals that vanished, in what is referred to as the Quaternary Megafauna Extinction. Most evidence now points towards humans being a key driver, mostly through hunting, even though there were likely fewer than five million people in the world at the time. By 1900, wild mammals had seen another large decline, but the pressures had shifted. The rise of agriculture alleviated some of the direct pressure from hunting, but the need for agricultural land meant the loss of wild habitats. Wild mammals saw another large decline in the last century, while the human population increased, and livestock even more so. With only around three million tonnes of wild land mammal biomass left, a return to wild hunting is not an option at any larger scale: if the world relied on wild mammals for the livestock meat it consumes, they would all be eaten within a month. But the alternative of continued growth in livestock consumption is also not sustainable. If we can reduce agricultural land — and primarily land use for livestock — we can free up land for wild mammals to return. Agricultural land per person has more than halved since 1960, and global agricultural land has declined slightly since 2000. Plant-based diets and alternative meat products could help, but the biggest barriers will be scale and affordability.
Read more about the history of malaria, and how the world can continue to make progress against it: ourworldindata.org/malaria Other sources & data: who.int/teams/global-m… who.int/publications/i…
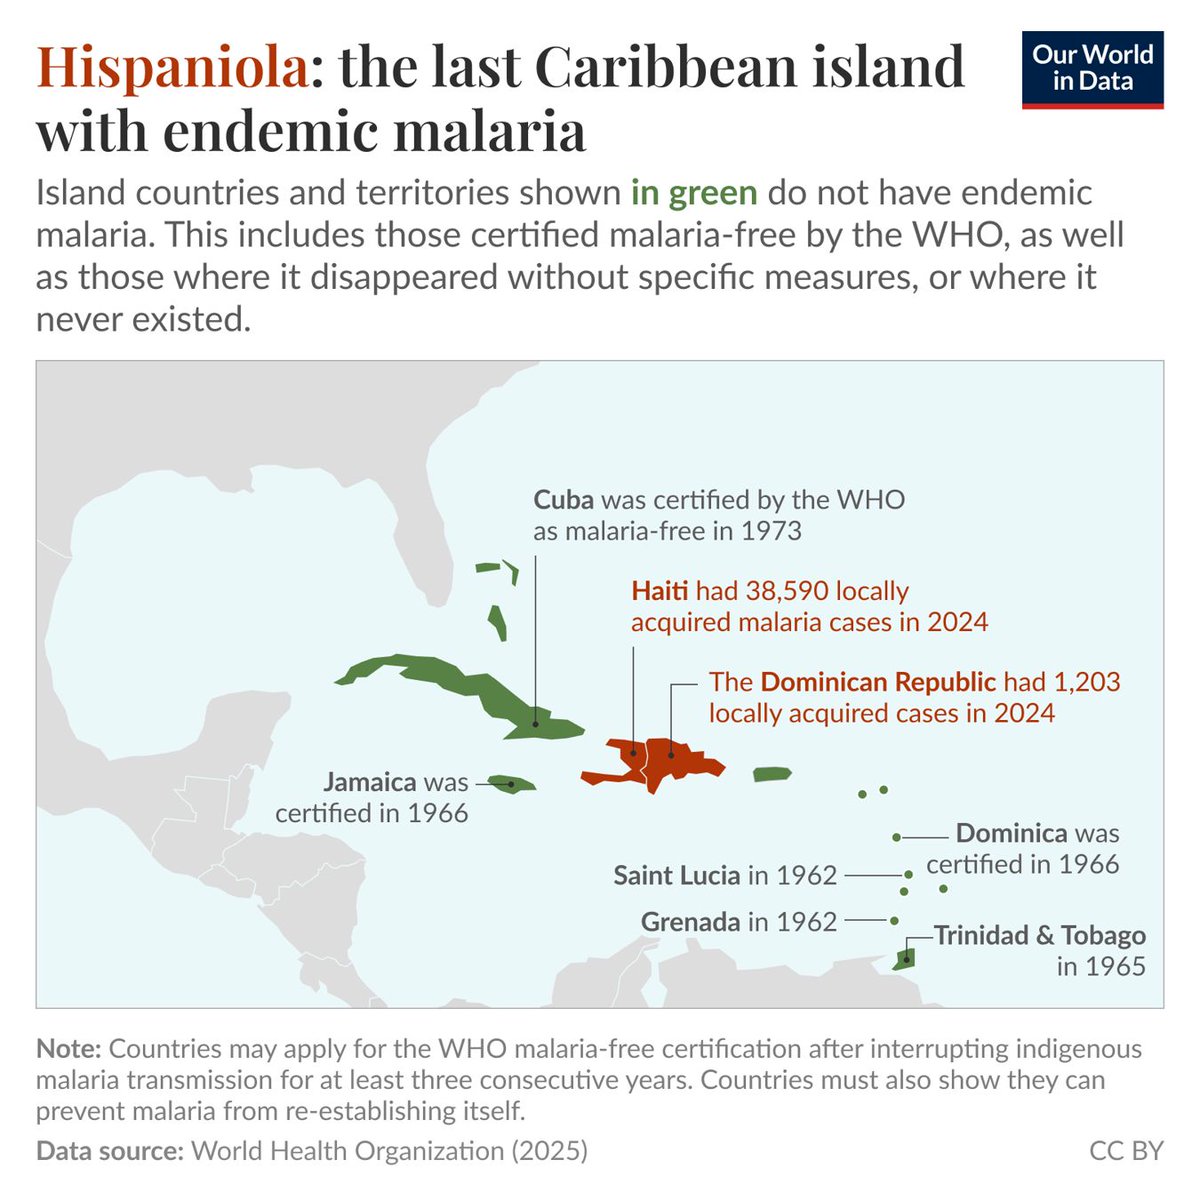
Haiti and the Dominican Republic share the last Caribbean island with endemic malaria. Malaria was once endemic across much of the Caribbean. This map shows how much progress has been made: the islands in green are all malaria-free. Some of these islands were certified by the WHO to have eliminated the disease decades ago. This requires, among other things, zero indigenous cases for three consecutive years. The list includes Grenada and Saint Lucia in 1962, Trinidad and Tobago in 1965, Dominica and Jamaica in 1966, and Cuba in 1973. Others are on the WHO’s list of countries where malaria never existed, and those where it disappeared without a deliberate anti-malaria campaign. At the center, you can see Haiti and the Dominican Republic, which share the island of Hispaniola. They are the Caribbean’s last island countries with endemic malaria. The Dominican Republic is much closer to elimination — it reported around 1,200 locally acquired cases in 2024, compared with almost 38,600 in Haiti. But its success depends on Haiti’s too, because malaria doesn’t stop at the border. This is why malaria eradication needs coordinated efforts across countries. (written by @EOrtizOspina)
Explore all of the updated data in our interactive charts: ourworldindata.org/search?dataset…
How fast is the world building up solar power? The International Renewable Energy Agency (IRENA) is an intergovernmental organization with 172 countries and the European Union. Its Renewable Energy Statistics is a reference dataset on how much renewable power capacity has been installed around the world. IRENA gathers the figures each year from national statistical offices, energy ministries, and industry associations, and fills gaps from official reports. The data covers almost every country from 2000 to 2025, broken down by technology: solar, wind, hydropower, bioenergy, geothermal, and others. The chart shows the total solar capacity installed in each country, in gigawatts. Note that the figures are cumulative: they count every panel still in operation, not only those added in a given year. The world added more than 500 gigawatts of solar in 2025 alone — more than twice all the solar capacity that existed anywhere in 2015. China alone accounts for half of the world’s cumulative total, with 1,200 gigawatts. Our principal data scientist Pablo Rosado recently updated our charts with IRENA’s July 2026 release, which adds data for 2025. In the same pass, he updated two other IRENA datasets we rely on: the cost of electricity from renewable plants, and patents in renewable energy technologies.

Explore all of our data and research on smoking across the world: ourworldindata.org/smoking Other sources & data: ourworldindata.org/grapher/share-…
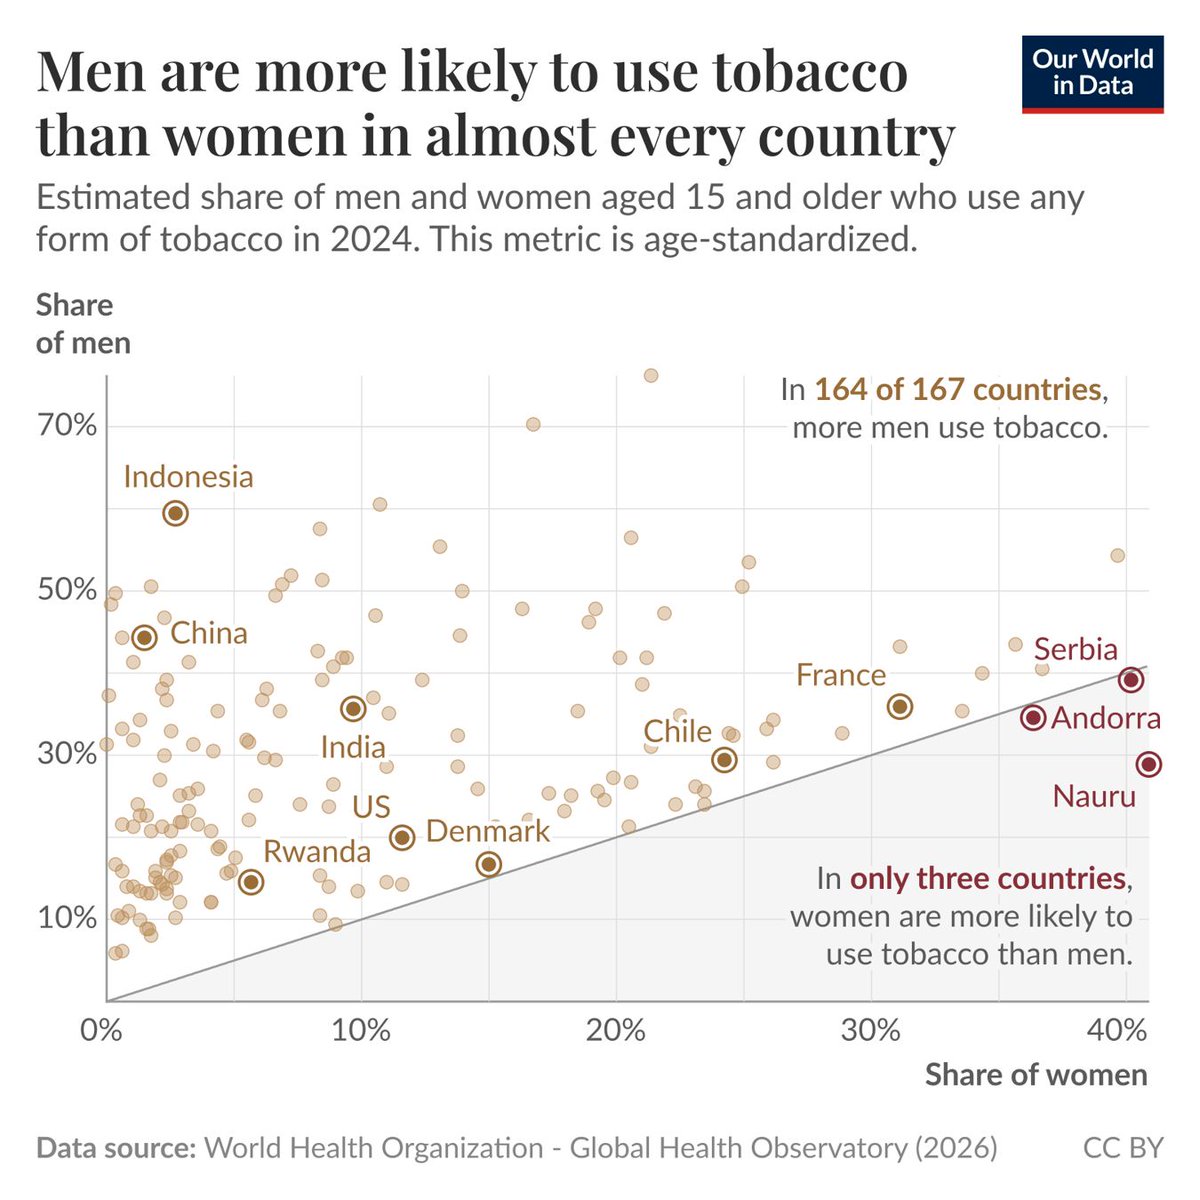
Around one-fifth of adults in the world use tobacco. But large gaps often exist in smoking rates between genders. Globally, more than one-third of men use tobacco, while less than one in ten women do. Men are more likely to use tobacco in almost every country in the world. You can see this on the chart, which plots the share of men (on the vertical axis) versus the share of women (on the horizontal axis). Nearly all countries lie above the diagonal line, which means more men do so. This data is collated and published by the World Health Organization. It’s based on adults aged 15 years and older and includes all tobacco products. In most countries, smoking is the main form of tobacco use, but in some, smokeless or chewing tobacco is more common. (written by @_HannahRitchie and @parriagadap)
Read the article by @_HannahRitchie: ourworldindata.org/is-organic-far…
📝 New article on Our World in Data: Is organic farming better for the environment than conventional farming? One of the most common questions we’re asked about food systems is whether organic farming is better for the environment than conventional methods. We wrote about this many years ago, but wanted to revisit this question and answer it based on the most recent available studies. The very clear takeaway is that there is no clear-cut winner. Organic farming tends to perform better on ecotoxicity metrics and can support more biodiversity on a given farm. Conventional farming consistently wins in land use; it achieves higher yields, so it requires less land to grow a given amount of food. On impacts such as greenhouse gas emissions and water pollution, organic farming tends to win per hectare. But because it achieves lower yields, this benefit disappears when we compare it per kilogram of food. When it comes to carbon emissions, there is no obvious winner. The largest differences we see are between different types of foods. The environmental impacts of beef or pork, for example, are far higher than those of plant-based foods, regardless of whether they’re organic or conventionally farmed. The key limiting factor for organic farming is land use. A future with more organic farming and less agricultural land than today would only be possible with larger shifts toward more plant-based, less land-hungry diets.

Read Hannah's article on how much energy data centers and artificial intelligence use: ourworldindata.org/how-much-energ… Other sources & data: qz.com/us-states-data… powering-intelligence.epri.com/executive-summ… cso.ie/en/statistics/…
Around 5% of electricity in the United States is used for data centers — far more than the global average. Around 1.5% of the world’s electricity was used for data centers in 2025. People are often surprised by how low this number is. While data centers are a relatively small share of global electricity demand, this is not true everywhere. You can see the differences across several world regions in the chart. The United States is home to the largest share of the world’s data centers. In 2025, they consumed around 5% of the country’s electricity. But demand is even more localized than this. There are numerous states where data centers represent more than 10% of power demand. In Virginia, it’s over a quarter. Even in Europe, this demand is very concentrated; beneath its 2% figure is Ireland, where data centers consume over 20% of electricity. This local concentration of demand — combined with the speed at which AI is progressing — puts pressure on grids, even if electricity demand is not overwhelming at the global level. (written by @_HannahRitchie)

Read the article by @_HannahRitchie: ourworldindata.org/stunting-defin…
Stunting is one of the leading measures used to assess childhood malnutrition. It indicates that a child has failed to reach their growth potential as a result of disease, poor health, and malnutrition. A child is defined as “stunted” if they are too short for their age. Stunting is not just an issue during childhood. It affects both physical and cognitive development – impacts that can persist throughout someone’s life. Stunting is measured based on a child’s height relative to their age. The World Health Organization sets out global growth curves — these show the expected trajectory of a child’s growth from birth through to adulthood. Of course, we would not expect everyone to be exactly the same height — there are a range of factors, such as genetics, which influence our height and are not a reflection of poor health or malnutrition. These growth curves, therefore, span a range of heights, with an ‘acceptable’ range of two standard deviations above and below the median. A child whose height falls below the bottom of that range — that is, two standard deviations below their expected height for their age — is defined as “stunted”. In a population, the prevalence of stunting is defined as the share of children under five years old who fall two standard deviations below the expected height for their age. Stunting can occur throughout childhood, but is largely determined by a child’s “first 1,000 days”. This stretches from the period just before conception through to the child’s second birthday. This is when a child experiences their most rapid phase of growth and development.

Compare China against other countries across dozens of indicators in our country profile: ourworldindata.org/search?countri… Other sources & data: ourworldindata.org/grapher/resear… ourworldindata.org/data-insights/… ourworldindata.org/grapher/labor-…
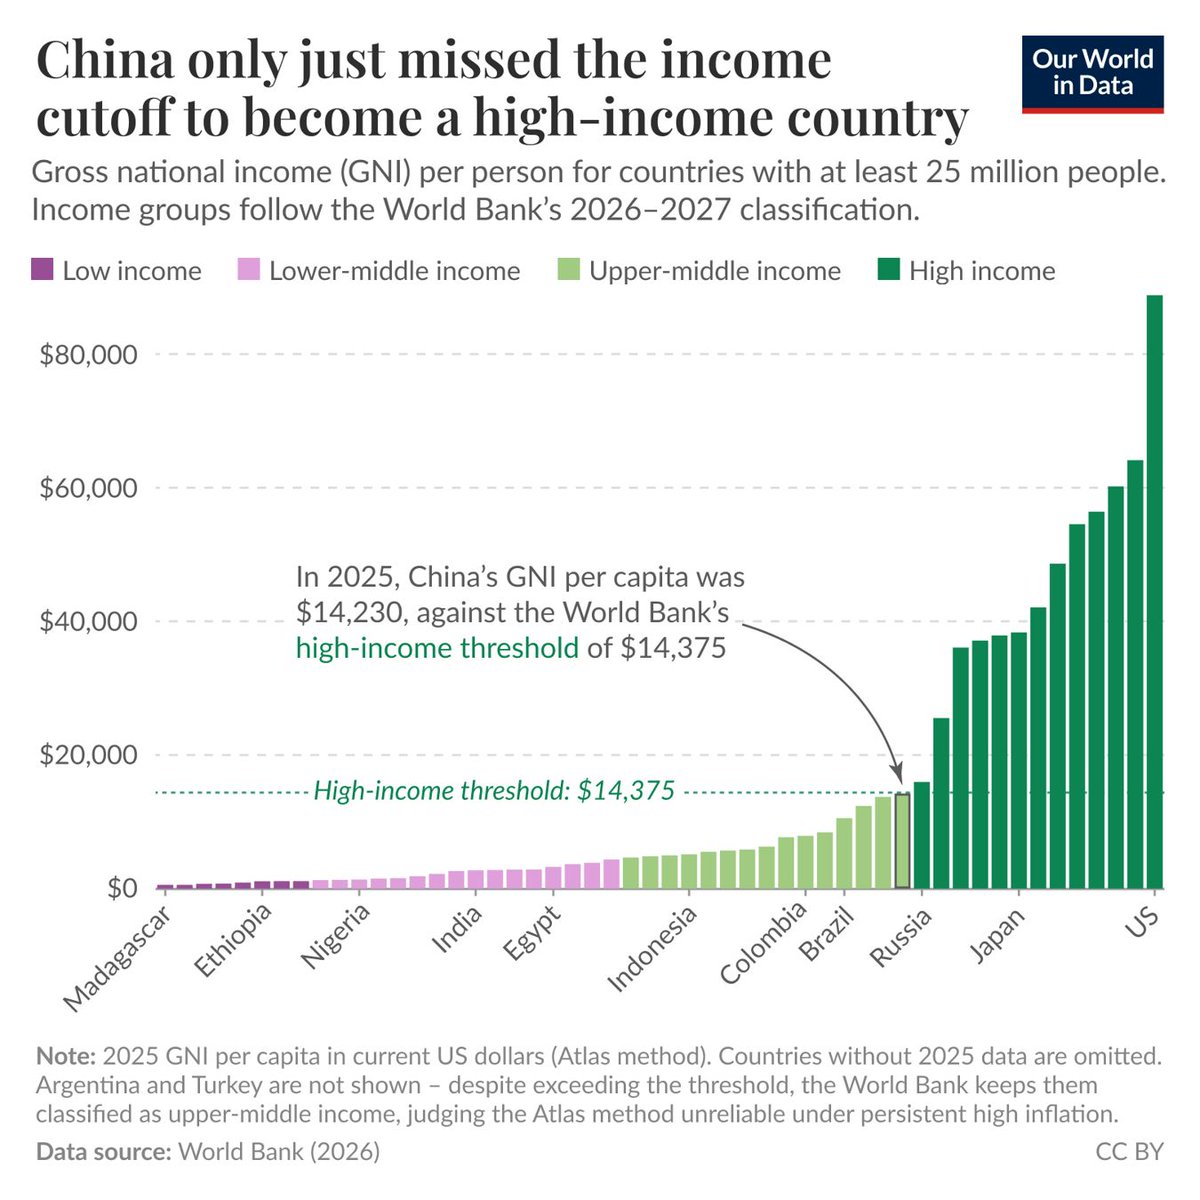
China only just missed the income cutoff to become a high-income country this year. In July every year, the World Bank sorts countries into income groups based on their per capita gross national income (GNI) in the previous year. In this year’s update, China was very close to entering the high-income group: its GNI per person was $14,230; just short of the World Bank’s high-income threshold of $14,375. The chart puts this in perspective. The bars show GNI per person for countries with at least 25 million people, ordered from poorest to richest. Beyond income, China is already comparable to high-income countries in many dimensions. Its spending on research and development as a share of GDP, for example, is higher than in many European countries. It’s also a global leader in several technology fields, including clean energy and artificial intelligence. But in other ways, China is closer to middle-income countries. Its productivity, measured by GDP per hour worked, for example, remains much lower than in high-income countries. (written by @EOrtizOspina)
Explore the interactive version of this map: ourworldindata.org/grapher/public…
The World Bank’s Worldwide Bureaucracy Indicators (WWBI) is a key dataset that helps us understand employment and wages in the public sector: how many people work there; their age, gender, and education; how their pay compares with the private sector; and more. The World Bank bases these figures on household and labor force surveys and administrative records. The WWBI covers around 200 countries and economies and has data going back to 2000, though coverage varies by indicator. The map here shows one of the WWBI’s key indicators: public sector employment as a share of total employment. Because that total includes the self-employed, the share is smaller in countries where many people work for themselves, as is the case in much of South Asia and Sub-Saharan Africa. Our data scientist @parriagadap recently updated this chart with the latest WWBI release, which adds data for 2021 and 2022 for a handful of countries and earlier years for many more. Because these surveys aren’t run every year, most countries’ latest data is from 2020 or earlier, and the map shows each country’s most recent year since 2012.

Hannah Ritchie @_HannahRitchie
79K Followers 1K Following Deputy Editor @OurWorldinData / Researcher at @UniofOxford / Clearing the Air: https://t.co/4RY8Br1Ih6
Max Roser @MaxCRoser
272K Followers 1K Following Data to understand global problems and research to make progress against them. Founder of @OurWorldInData / Professor at @UniofOxford
Human Progress @HumanProgress
198K Followers 772 Following A @CatoInstitute project. Subscribe to our newsletter: https://t.co/j30bRWWLoJ
Statista @StatistaCharts
144K Followers 1K Following We’re no longer active on this platform. Follow us on Instagram, LinkedIn and Facebook for the latest insights.
Stefan Schubert @StefanFSchubert
53K Followers 2K Following I run The Update newsletter. Book: https://t.co/I5zN3WGe0p
Jason Crawford @jasoncrawford
45K Followers 4K Following I write and speak about the history & philosophy of progress. Founder, @rootsofprogress. Host of the Progress Conference. Author, The Techno-Humanist Manifesto.
Edouard Mathieu @redouad
33K Followers 257 Following Head of Data & Research at @OurWorldinData • Open data and research on the world's largest problems • Currently off Twitter, please reach out via my website
Spencer Greenberg �... @SpencrGreenberg
39K Followers 7K Following A psychology researcher/mathematician/entrepreneur. I tweet about psychology, society, rationality, science, and philosophy. My book: https://t.co/qd3iRl7q1X
Rob Wiblin @robertwiblin
52K Followers 872 Following Host of the 80,000 Hours Podcast. Exploring the inviolate sphere of ideas one interview at a time: https://t.co/2YMw00bkIQ
Saloni @salonium
37K Followers 2K Following Co-founder & editor @WorksInProgMag. Writer, Scientific Discovery. Podcaster, Hard Drugs. Advisor, @coeff_giving. 🏳️🌈
Asjad Naqvi @AsjadNaqvi
15K Followers 726 Following PhD Econ @NSSRNews 12. Habilitated. Stata stuff. Climate analytics, diagnostic tools, data science. @WIFOat + a few other affiliations.🌍
Amanda Askell @AmandaAskell
112K Followers 663 Following Philosopher & ethicist trying to make AI be good @AnthropicAI. Personal account. All opinions come from my training data.
Johannes Haushofer @jhaushofer
29K Followers 3K Following Economist at @CornellEcon and @CornellBPP. Founder @malengo @busaracenter. Also @SU_Economics and @eeg_mpi.
Habiba 🔸 @FreshMangoLassi
5K Followers 509 Following Co-founder @SpiroTB - TB screening and prevention charity focused on children https://t.co/sBf6ONGMSL 🔸 10% Pledge #103 with @Givingwhatwecan @habibabanu.bsky.soc
Abhijeet Singh @singhabhi
18K Followers 5K Following Dev economist at Stockholm @handels_sse and @JPAL. Past:@NuffieldCollege @EconUCL.Tweets on econ, edu, India, miscellanea.
Ilya Kashnitsky — b... @ikashnitsky
6K Followers 2K Following b s k y — @ikashnitsky.phd Demographer at Statistics Denmark/ PhD'20 U Groningen / EDSD 2017-18 / @datavizartskill #demography #openscience #rstats #dataviz
Cédric Scherer @CedScherer
24K Followers 2K Following Inactive account → find me on BlueSky and LinkedIn 🧙♂️✨📊 Independent #DataViz Consultant & Designer 👨🎓🌿🐗 PhD in Computational Ecology
zzDANIEL_ETH @daniel_271828
11K Followers 1K Following Researching effects of automated AI R&D | pro-America, pro-tech, & pro-AI safety
Michael Plant @MichaelDPlant
3K Followers 567 Following Philosopher and global happiness researcher. Founder and Director, @HappierLivesIns. Postdoctoral Fellow @OxWellResearch @UniofOxford. All views yours, weirdly.
Nicholas D. Carter @NicholasDCarter
7K Followers 917 Following 🌳Director of Environmental Science | Game Changers Institute 📚 Research Fellow | Project Drawdown 🌱Co-founder https://t.co/mAadDmajoI
Onsases @Onsases1
99 Followers 3K Following
Shite Buster @Justice4Abo
77 Followers 135 Following Justice for the #Aborigines and other #natives around the world -- who have been chained, enslaved and colonized by Europeans for centuries, to this day.
Shrek @ShreyaEswaran
9 Followers 245 Following Trainee Data Journalist @bsindia @ACJIndia'26 ಮೈಸೂರು🏠
le balai @lebalai135629
14 Followers 374 Following
The Realist Lens @RealistLensHQ
0 Followers 15 Following Power, politics, ecology & consciousness without tribes or gurus. Facts ≠ claims ≠ interpretation. See the system. Examine the self.
tou guan @wakaba322312
3 Followers 27 Following

Frank G. Tovar Z. @waramasen
113 Followers 2K Following Doctor en Antropología (ULA); MSc. (CIDIAT-ULA); Ing. For (ULA); Profesor universitario. Agroforestería y Desarrollo Territorial Rural con Identidad Cultural.

Peter🇩🇪🇺🇦 @HellmPeter
91 Followers 1K Following Dipl.-Ing., TUM, CTO. Private views on renewable energy, heat pump, BEV and other topics.

Jose L. Alcantara @Jlalcantbirdy
72 Followers 356 Following
xdiffargs @xdiffargs
0 Followers 123 Following
What is life? @chooiyc
55 Followers 59 Following RTs r 2 share knowledge & info | ❤️ for later reading | Addicted 2 podcasts | https://t.co/5lewENmQsM ☕️
P M KARTHIKEYA REDDY @pmkarthikeya50
2 Followers 29 Following
🐆Lucero Vaca-Leon�... @lucero_vaca_
805 Followers 2K Following 🇲🇽| DPhil Candidate @UniofOxford @WildCRU_Ox| Grantee/Scholar of @TheWCS @wildnetorg| Jaguar behavioural and movement ecology🐆🐾#LatinaInSTEM
Conor Gil @ebfbefjbfjbdr
0 Followers 2K Following
Dndmd @Dndmdx9
5 Followers 49 Following

HUI @peopleonearth39
6 Followers 319 Following
El Puma de la Tahona @pumadelatahona
58 Followers 262 Following Entusiasta de la IA | Le doy palo al gobierno de turno, principalmente si es de izquierda | Mucha ironía y sarcasmo
Bradford Harriman @sleepnir
443 Followers 3K Following
H @H56475054
78 Followers 4K Following
Rashmi @TheIdesOfMarch4
0 Followers 158 Following Introvert | Seriously funny | Weirdly normal | Wisely foolish :P
Ann @ana_nnda
214 Followers 2K Following La Verdadera #NaturalezadelaRealidad🐰#AgainstNWO🤜🐲⚜️🐍🤛 #Stop5G #WakeUp #Resistencia✊ #HuertosUrbanos🌱 #CaptaAguadeLluvia🌧️ #Agroecología #Regeneracion
The Doomsday Optimist @TheDoomOptimist
1 Followers 12 Following The world is always ending. Until it doesn’t. Yesterday’s catastrophes. Today’s progress. Tomorrow’s possibilities.
o @elisabethlamar1
818 Followers 66 Following
Ahmad @ahmad370N
3 Followers 183 Following I am an energy expert and consultant, working to improve energy access and consumption for commercial and industrial entities in Pakistan

Erika @ErikaNayton
0 Followers 4 Following Into facts, reading, research, and learning random interesting things.
Sdt Dmr @sdtdmrwork
3 Followers 129 Following
Deiver Cuesta Ossa @CuestaOssa
13 Followers 438 Following
Chakir El hajji @el_hajji_chakir
7 Followers 95 Following
X user @asusz3r0
0 Followers 29 Following
Garth Clark Sweet @GarthClarkSLEEP
0 Followers 28 Following
Yuvraj Singh @W0nderingwhyy
0 Followers 226 Following


Mike Carberry: The An... @mikecarberry
3K Followers 6K Following JFAN (Jefferson County Farmers & Neighbors): Development Director/Former Johnson County Iowa Supervisor/Green State Solutions: Director
chy @chiron365
382 Followers 6K Following
Yachy @AssignFile
375 Followers 1K Following 東京と大阪の往復から始めた、読書、科学、知財の記録┃博士(農学)、化学メーカー勤務┃気になってること:①MOT、②知財管理士1級(ブランド、特許)③科学政策┃ストレングスファインダー(収集心、学習欲、公平性、内省、規律性)
Manny @hyovans
8 Followers 35 Following

Erick M. Corimanya-Yu... @ErickCorimanya
276 Followers 426 Following Environmental governance: Amazon deforestation, water reuse, energy justice | PhD researcher, USP 🇧🇷 · MSc Leeds 🇬🇧 | Ciencia desde el Sur Global
OSINT @OsintChuDauBac
4 Followers 490 Following 国際的な動向と対立に関する研究 - Nghiên cứu xu hướng & Xung đột quốc tế Research on International Trends & Conflicts
Usman Sikander @DrUSikander
4 Followers 77 Following PhD Aerospace Engineering | Chartered Engineer | All views are personal
Alex Murat @Alexc8839
27 Followers 248 Following
wo s his s @HisWo47874
6 Followers 63 Following
Hannah Ritchie @_HannahRitchie
79K Followers 1K Following Deputy Editor @OurWorldinData / Researcher at @UniofOxford / Clearing the Air: https://t.co/4RY8Br1Ih6
Max Roser @MaxCRoser
272K Followers 1K Following Data to understand global problems and research to make progress against them. Founder of @OurWorldInData / Professor at @UniofOxford
Edouard Mathieu @redouad
33K Followers 257 Following Head of Data & Research at @OurWorldinData • Open data and research on the world's largest problems • Currently off Twitter, please reach out via my website
Bertha Rohenkohl @BerthaRohenkohl
417 Followers 937 Following Not posting on this account anymore. You can find me on LinkedIn or Bluesky. Research and Data Economics Lead @OurWorldInData | Views my own.
Tuna @antea04
176 Followers 65 Following (she/her) data scientist @ owid, puzzle aficionada and generally curious about the world 🎲🍃👩🏻💻 - 📍 ldn
Angela Wenham @angelawenham
40 Followers 187 Following
Martin Račák @rakyi_
91 Followers 745 Following Trying to figure out what's going on, how things work, and to not get upset while programming. Engineer @OurWorldInData.
Antoinette Finnegan @AntoinetteF_18
23 Followers 52 Following


VRM @MuigaiValerie
47 Followers 40 Following
Daniel Bachler @DanyX23
881 Followers 2K Following Head of Engineering @OurWorldInData, author of https://t.co/8Dqm5584Xw. He/Him
Bastian Herre @bbherre
2K Followers 472 Following Researcher @OurWorldInData. I make research on democracy, human rights, armed conflict, and violence easier to access and understand. he/him
Fiona Spooner @f_spooner
1K Followers 955 Following Senior Data Scientist @OurWorldInData 🌈🌎🌍🌏 [email protected]
Lucas Rodés-Guirao @lucasrodesg
955 Followers 545 Following data at @OurWorldInData open source, open data, ai/ml he/him 🌱
Marcel Gerber @MarcelGerber9
449 Followers 1K Following computer science student @RWTH & developer for @ourworldindata. into charts and trains.
Matthieu Bergel @mlbrgl
201 Followers 0 Following Hi, I'm Matthieu. I leverage web technologies to do good - Currently working on @OurWorldInData's web platform and publishing tools.
Charlie Giattino @charliegiattino
938 Followers 171 Following I care about understanding the world and making it better.
Bobbie Macdonald @bnjmacdonald
498 Followers 310 Following Stanford PhD. Currently working with the @OurWorldinData team on #COVID19.
Joe Hasell @JoeHasell
1K Followers 291 Following Head of Product @OurWorldInData | PhD candidate @DSPI_Oxford @INETOxford
Esteban Ortiz-Ospina @EOrtizOspina
9K Followers 947 Following - Executive Co-Director of @OurWorldInData - Honorary Researcher @OxMartinSchoolTrends for United States
You might like