Compounding Lab @CompoundingLab
Chief DCF manipulator, market investigator and fundamental chartist. ACCA, CISI. Dynamic asset allocation. Not financial advice. compoundinglab.substack.com quickfs.org Joined January 2016-
Tweets6K
-
Followers3K
-
Following365
-
Likes5K
Full list of my Polymarket positions. Current stage: accumulating. Today, Trump is saying once again that Ukraine-Russia war will end soon. The reason why he is saying this is a mix of real diplomatic activity + deliberate pressure/optimism, rather than because there is public evidence that a full ceasefire is already close. Trump has been saying versions of this for months. On July 6 he said the war was “getting closer than people realize,” after speaking separately with Putin and Zelenskyy. Reuters noted at the time that Trump gave no specific reason for that confidence. Then at the UN on September 22 he again said he thought an end would come “more quickly than people understand.” There are nevertheless a few concrete reasons why he may genuinely think the situation is moving. First, US diplomacy restarted in September after roughly six months of stagnation. Witkoff and Kushner visited Moscow and Kyiv, and Washington has been discussing a new “peace package.” Russia, Ukraine and the US have also accepted in principle the idea of another trilateral round of talks. Second, Trump seems to believe that both sides are under increasing pressure. Ukraine has inflicted serious damage on Russian energy infrastructure, while Ukraine itself faces another difficult winter and remains heavily dependent on Western military and financial support. That creates incentives on both sides to explore at least limited agreements. Trump has explicitly been pushing an energy ceasefire as a possible first step. Third, Trump appears to think he has leverage over Russia economically. His administration is simultaneously discussing sanctions, energy issues and potentially substantial future US-Russia commercial relations. The Kremlin itself said Trump told Putin that ending the war could open the way to a major restoration of US-Russian economic ties. Recent reporting also says US-Russia discussions have touched on a multibillion-dollar oil transaction. But there is a major contradiction: Putin's public and reported private positions don't currently look like those of someone preparing to sign a general ceasefire immediately. Reuters reported in July that people close to the Kremlin said Putin was rejecting compromise and still wanted control of the remainder of Donbas; one source said he had rejected advisers' suggestions for a ceasefire along the existing front. And as recently as 1 October, Putin rejected the proposed exchange of limits on long-range/energy attacks, while saying Russia still preferred an eventual negotiated end. Today, October 6, Ukraine is also warning that Russia appears to be preparing another major aerial attack. Therefore, we should interpret Trump's wording approximately like this: ~40% genuine belief based on private conversations that there is a negotiable landing zone; ~30% negotiating tactic - publicly saying agreement is close can put pressure on Putin and Zelenskyy to behave as though it is; ~20% domestic politics/economics - Trump badly wants lower energy prices and a visible foreign-policy success; ~10% Trump's normal tendency to express very optimistic timelines. Those percentages are my judgment. For my Polymarket ceasefire-agreement positions, I don't treat Trump's statement alone as strong evidence that a qualifying agreement is imminent. I would become much more bullish on YES if we saw one of these concrete developments: Russia accepting the principle of a general ceasefire, a Putin-Zelenskyy/Trump summit with an actual ceasefire text under discussion, negotiators beginning work on a dated frontline-wide halt, or Kremlin language shifting from “root causes first” toward “ceasefire first.” At the moment, Trump's rhetoric is noticeably more optimistic than the observable Russian negotiating position. That gap is the most important thing I keep in mind.
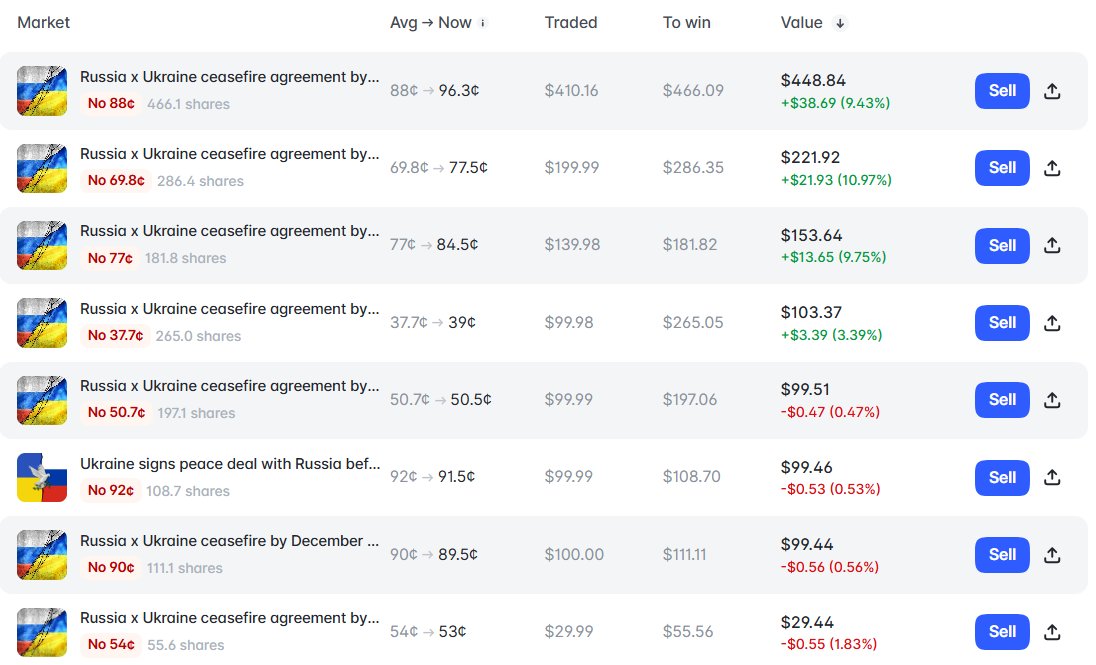
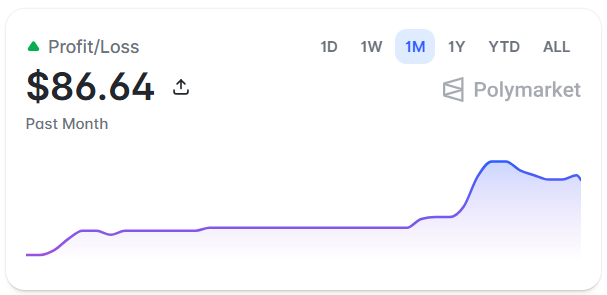
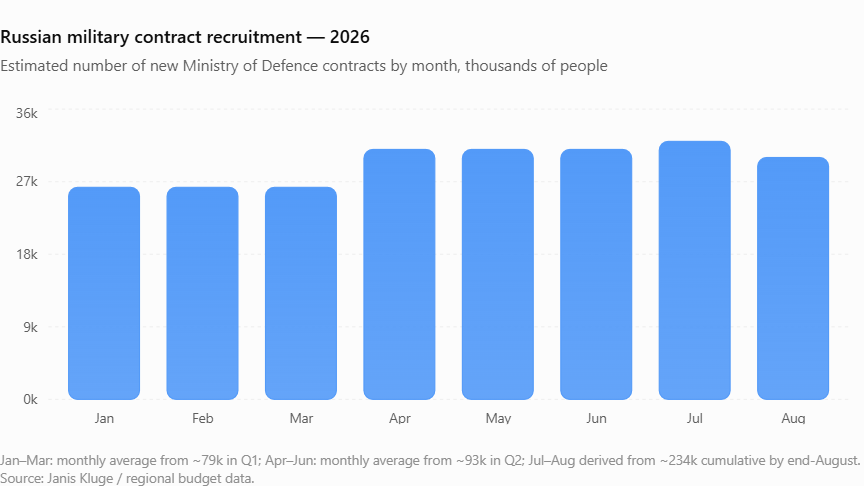
17% in just one month. I do not believe in a quick ceasefire between Ukraine and Russia. To evaluate my position, I check how many new contract soldiers Russia recruits monthly, and this trend tells me they do not have any intention of stopping anytime soon. I can be wrong - it's politics and everything can change fairly quickly. Therefore, do not copy my trades. It is a very small share of my total portfolio.
Marvell Technology $MRVL is up sharply today, primarily because of its Investor Day. Management now giving much stronger long-term AI/data-center targets than the market expected. Shares have been roughly +6–8%, after rising as much as 11% intraday. Here are some numbers that moved the stock: - FY2028 revenue target: $20B, versus Wall Street around $18.2B. - FY2031 revenue target: 70-90B, with an $80B midpoint. Consensus had been only about $46.9B -> projected business almost 70% larger than analysts were modeling. - Marvell increased its FY2029 custom-AI silicon revenue expectation to $12B, from $10B previously. - By FY2031, management sees roughly $30B from custom compute/chips and around $37.5B from interconnect/connectivity. - Management is targeting >$30 adjusted EPS in FY2031 and a roughly 56–59% gross margin. This isn't simply generic “AI enthusiasm.” Investors had been worried that Marvell was too dependent on a small number of hyperscaler customers and that $AVGO could dominate custom AI ASICs. Today's presentation strengthened the opposite thesis: * Marvell claims it now has a broader set of hyperscaler design wins, with growth not only in custom AI accelerators but also in optical DSPs, networking and high-speed interconnects. Analysts specifically highlighted that diversification away from excessive reliance on Amazon. This comes on top of already strong fundamentals: in Q2 FY2027, Marvell's revenue grew 37% YoY, while Data Center revenue grew 46%, with management saying AI bookings were exceptionally strong. In short, today's jump is due to a huge upward revision to the market's 2028–2031 earnings/revenue expectations.
@thefrejalind The answer is too obvious here to say it loudly.
There is a resemblance to the late 1970s in bonds behaviour. Particularly in the way long-term government bond yields are refusing to fall despite signs of softer growth. At the same time, the inflation signal from bonds today is much less alarming than it was approaching 1980. Today the U.S. 10-year Treasury is around 5.3%, near its highest level since the early 2000s. Yields have remained high even after weaker employment data reduced expectations of an immediate Fed hike. Here is comparison of the two periods (1977–80 vs2026): * 10Y Treasury:7% -> 12% vs 4% Feb -> 5.3% now * Headline inflation: 5% -> 15% vs3.4% * Core inflation:accelerating strongly vs 2.4% * Long-term inflation expectations:becoming unanchored vs 2.35% * Main bond-market fear: persistent inflation vsinflation + fiscal deficits + high real rates/supply * Fed credibility: increasingly questioned vsconsiderably stronger The late-1970s pattern is particularly striking. The 10-year yield fell to about 6.9% at the end of 1976, then started climbing: roughly 8% in early 1978, 9% in early 1979, 10.3% in October 1979 and 12.4% by February 1980. At the same time, inflation, which had fallen to about 5% in 1976, reaccelerated and became entrenched. The Fed eventually had to tighten dramatically (Volcker's hammer). The worrying similarity is this: 1970s: inflation falls -> policymakers think the problem is improving -> energy/other inflation shocks return -> long yields start climbing again -> inflation subsequently accelerates. 2026: 2022 inflation falls -> Fed appears to have inflation largely under control -> another energy shock occurs -> long Treasury yields rise sharply -> markets become reluctant to own long-duration government debt. That part does look somewhat familiar. And currently headline CPI has moved back to 3.4%, with energy prices +16.3% YoY and gasoline +27.4%, although core CPI remains only 2.4%. But there is one enormous difference Bond investors are not currently pricing a 1970s-style inflation spiral. The 10-year Treasury inflation breakeven was only about 2.35% in September. In other words, despite a 5.3% nominal Treasury yield, the market still expects inflation over the next decade to average roughly 2–2.5%. Schematically it is 2.3% expected inflation + 3% real yield / term premium = 5.3% nominal 10Y yield Whereas approaching 1980, an increasingly large part of rising nominal yields reflected rising inflation expectations and declining confidence that inflation would be controlled. That distinction is crucial. Today's selloff appears to have at least three large components beyond inflation: 1. Huge Treasury supply / fiscal deficits. The CBO projects a U.S. federal deficit of about $1.9 trillion in FY2026, or 5.8% of GDP, exceptionally large for an economy not in recession. 2. Rising term premium. Investors want more compensation for locking money up for 10-30 years because of debt supply, fiscal uncertainty and inflation risk. 3. High equilibrium real rates / capital demand. AI infrastructure, investment and a relatively resilient economy are keeping demand for capital unusually strong. Recent analysis of the global rise in long yields points to investment demand, increasing long-duration bond supply and reduced demand from price-insensitive buyers. That is why the bond market can sell off without expecting 6-10% inflation. We should describe today's bond market as perhaps 30-40% reminiscent of 1977-79, not a replay of it. The chart pattern (long yields breaking higher after an apparent inflation victory) is of course uncomfortable. But the internal mechanics are very different. The real warning sign that would make me substantially more worried about a 1970s/1980 scenario would be something like: 10Y Treasury: 5.3% -> 6%+ 10Y breakeven inflation: 2.35% -> 3%+ Core CPI: 2.4% -> 3.5–4%+ while the Fed is reluctant to tighten because of growth/fiscal concerns. If instead the 10Y reaches 6% while breakevens stay around 2.3-2.5%, that's primarily a real-yield/fiscal/term-premium crisis, not a 1970s inflation replay. And that distinction would have very different implications for equities: a 6% Treasury caused by rising real yields is arguably worse for long-duration equity valuations than a comparable move caused purely by higher expected inflation. $TLT $SHY $LQD $IEI
@leevalueroach -13% 1year loss. Not impressed.
Hey, thanks. Truly appreciate. I heard about this approach from someone else. Your choice of course, but I prefer CAPM. Because companies defer by risk, so equalising defensive stock like pepsi and, for example highly indebted company like IREN does not make sense. Different risk profile, investors demand higher compensation. That is the main idea behind any valuation. You can't discount different cashflows with same rate. Take care 👊
There is a meaningful long-term risk of $OTIS losing market share to Chinese companies worldwide going forward. But I would currently classify it as moderate for Otis overall, rather than a major threat to the investment thesis. The risk is much higher in new equipment than in Otis's core maintenance/service business. Chinese competitors are clearly internationalizing. Canny Elevator's overseas revenue grew 33.7% in 2025, with projects in markets such as Singapore, Malaysia, Turkey and South Korea. However, overseas sales were still only about 10% of Canny's total revenue, so it remains nowhere near Otis's global footprint. Guangri is expanding even faster from a smaller base with reported overseas revenue +100% in 2025. At the same time, there is little evidence so far that this expansion is materially hurting the established Western elevator companies outside China. KONE $KNEBV , probably the best independent read-through for Otis, said repeatedly during 2025 and again in H1 2026 that intense price competition was concentrated in China, while pricing outside China remained relatively stable. Otis's own numbers tell the same story. In 2025, global New Equipment orders were flat, but +7% excluding China. Its maintenance portfolio grew 4% for the fourth consecutive year, reaching approximately 2.5 million units, while Service organic sales grew 5%. In Q2 2026, Service organic sales accelerated to +9% and modernization backlog was up 26% at constant currency. I would split the risk this way * China New Equipment: High. Domestic Chinese brands already strong; severe price competition * Emerging-market New Equipment: Moderate-High.Chinese OEMs increasingly exporting and building dealer networks * Europe New Equipment: Low-Moderate.Regulation, specifications, brand and local infrastructure create barriers. * North America New Equipment: Low. Higher regulatory/service/network barriers * Global maintenance: Low today. Requires dense technician network and long customer relationships * Modernization: Low-Moderate. Installed-base knowledge and service relationships favor incumbents * Overall OTIS:Moderate. Service increasingly dominates economics Otis has roughly 2.5 million units under maintenance out of a global installed base of around 23 million, or roughly 11%. A Chinese company selling an inexpensive elevator into Saudi Arabia, Vietnam or Brazil does not automatically take an Otis service contract away. For Chinese manufacturers to really damage the Otis moat, they would need to create something much harder than manufacturing capacity: thousands of trained technicians, 24/7 call centres, local spare-parts inventories, regulatory certifications, maintenance depots and long-term relationships with building owners across dozens of countries. That can happen, but it takes years. And interestingly, Canny's numbers illustrate this gap. Its total 2025 revenue was roughly RMB 4.45B and overseas revenue about RMB 443M. Installation and maintenance represented only about RMB 635M (USD 94M) of its entire business. Compared with Otis's 2.5 million-unit global service network (USD 9.4B revenue), these aren't comparable service infrastructures yet. Where I think the real danger lies I would watch Southeast Asia, India, the Middle East, Latin America and parts of Eastern Europe/Central Asia. There the typical sequence could be: Chinese OEM enters with cheaper equipment → gains installed base → establishes local technicians → starts retaining maintenance contracts → eventually competes for modernization. The first step is already happening. The crucial question is whether steps 2-4 happen at scale. If Chinese manufacturers merely take low-margin new-equipment share, the financial damage to Otis could actually be fairly modest. New Equipment is strategically important because it seeds future service contracts, but Service is where Otis earns the majority of its economics. That's why I would be much more concerned if we started seeing Otis's maintenance portfolio growth fall below global installed-base growth for several consecutive years. Currently: Global installed base: 23m units, growing mid-single digit Otis maintenance portfolio: 2.5m, +4% in 2025 Implied share: ~11% OTIS So there may already be slight dilution simply because the overall installed base grows a little faster than Otis's portfolio. But that's completely different from evidence of Chinese companies aggressively taking Otis customers. Therefore, I am treating Chinese competition as perhaps a second-order risk to the OTIS thesis today, rather than the primary one. The scenario that would make me substantially more bearish is Canny/Guangri/other Chinese OEMs reaching 25–30%+ of revenue outside China and simultaneously reporting very rapid growth in overseas maintenance portfolios. That's the point at which I'd start questioning Otis's global service moat rather than just its New Equipment competitiveness.
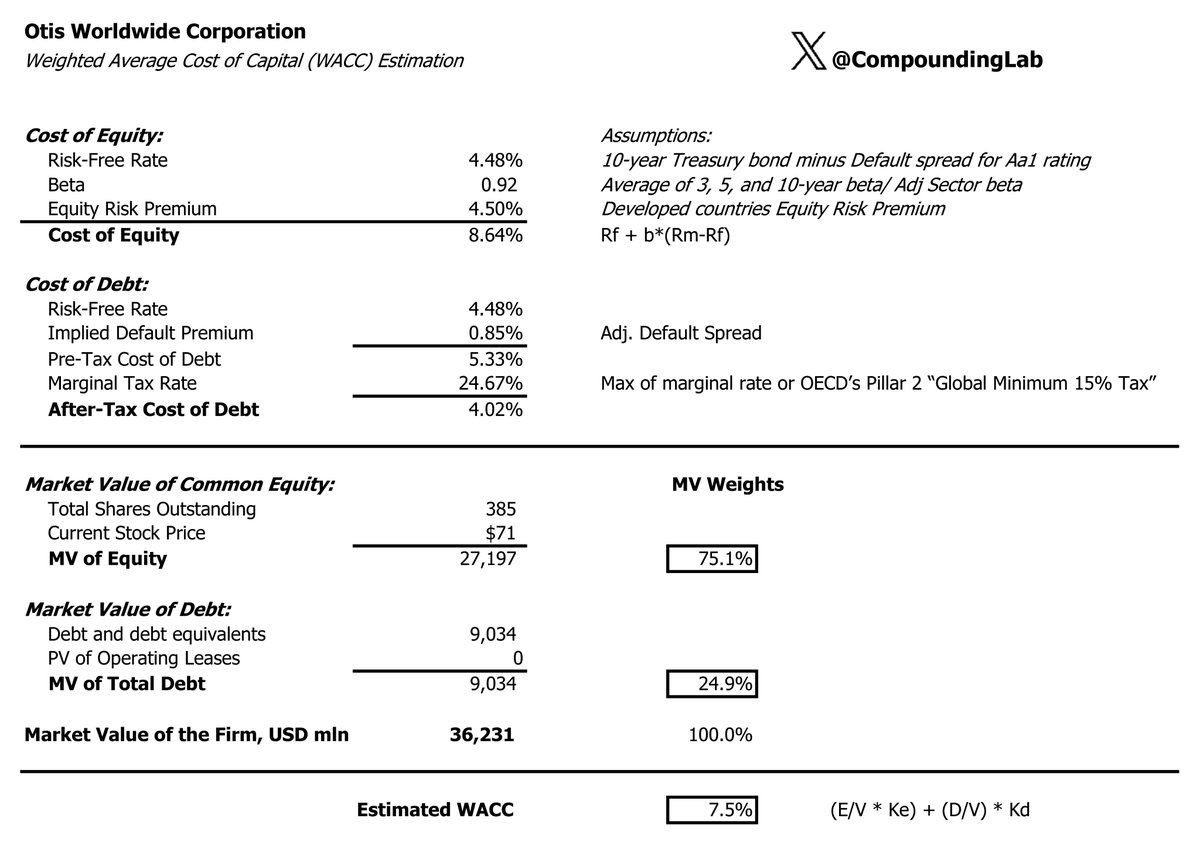
$OTIS DCF valuation model Nobody gets excited about elevator companies. Yet perhaps every second person uses OTIS equipment or services every single day. That kind of boring can become very interesting at the right price. Key assumptions: Explicit average 5Y/5Y growth @

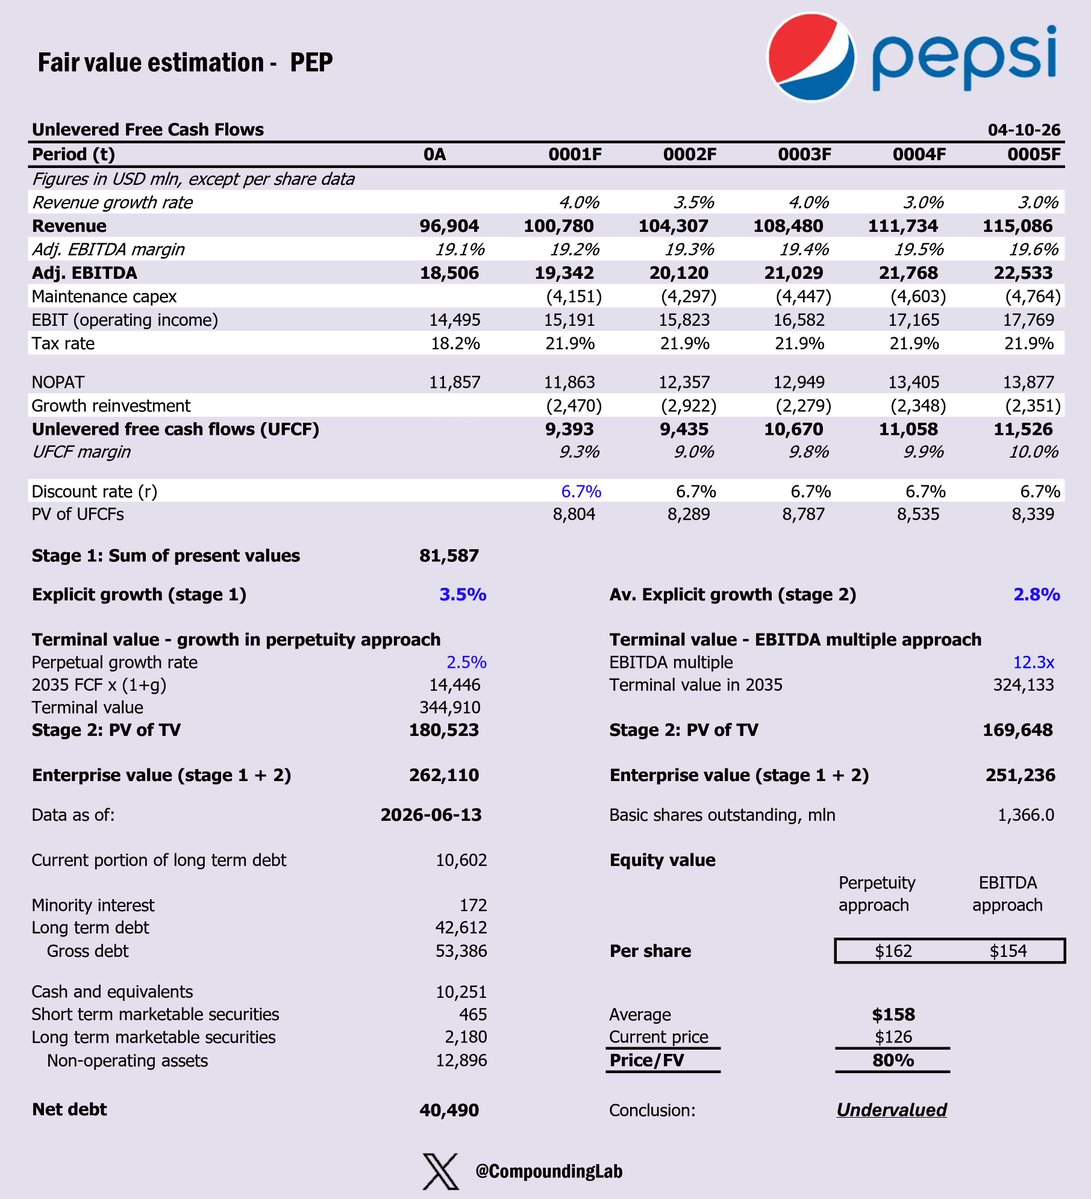
$PEP VALUATION MODEL Today, PepsiCo is not an average stock. It’s protection against a major market meltdown. Lay's, Doritos, Gatorade, a dividend yield of 4.7%, and an impressive 54 years of continuous dividend increases, all at the bottom of its 52-week range, down about 36% from its peak. Its standard deviation of price return is the lowest in the Morningstar Wide Moat universe, indicating that its price tends to bounce back to its fair value relatively quickly. So, what exactly is that fair value today? Let’s find this out together. KEY ASSUMPTIONS: * Average revenue growth of 3.5% in Years 1-5 and 2.8% in Years 6-10 * Long-term growth in perpetuity of 2.5% * Adjusted EBITDA margin rising from 19.1% to 20.1% by Year 10 * WACC of 6.7% * Terminal adjusted EBITDA exit multiple of 12.3x * Tax rate of 22%, broadly in line with PepsiCo’s core effective tax-rate guidance for 2026 * Marginal Sales/Capital ratio of 1.43 for growth reinvestment Sharing full workings on my Substack later today.
@commonsenseplay There is no free lunch. Credit spread is there for a reason. It reflects probability of default* LGD * EAD.
@cactusmaac For me it's already a buy. And that was not the point. The point was, if you claim possible entry price, there should be an explanation why.
When I see nonsense like this I laugh. No explanation of why 10 and not 8 or 15 PE. Dude, no one cares about your price unless you can reasonably explain your view.

$OTIS barely grows. And china is a problem. Plus cash conversion is not that good. 10-12x P/E is my price
@Connoisseur_GPW Check this and then we talk. Dividends has nothing to do here.

@Connoisseur_GPW Wrong. ROIC also matters and even small growth can deserve 15 multiple easily.
@Queteim76792057 I share my detailed workings on SS, feel free to check!
@HunterAllen4 @JungleStocks @MohanadInv @TechniCameron @realstockfox @Pep_Invest @haydeninvestsX @Solsk My man, appreciate!
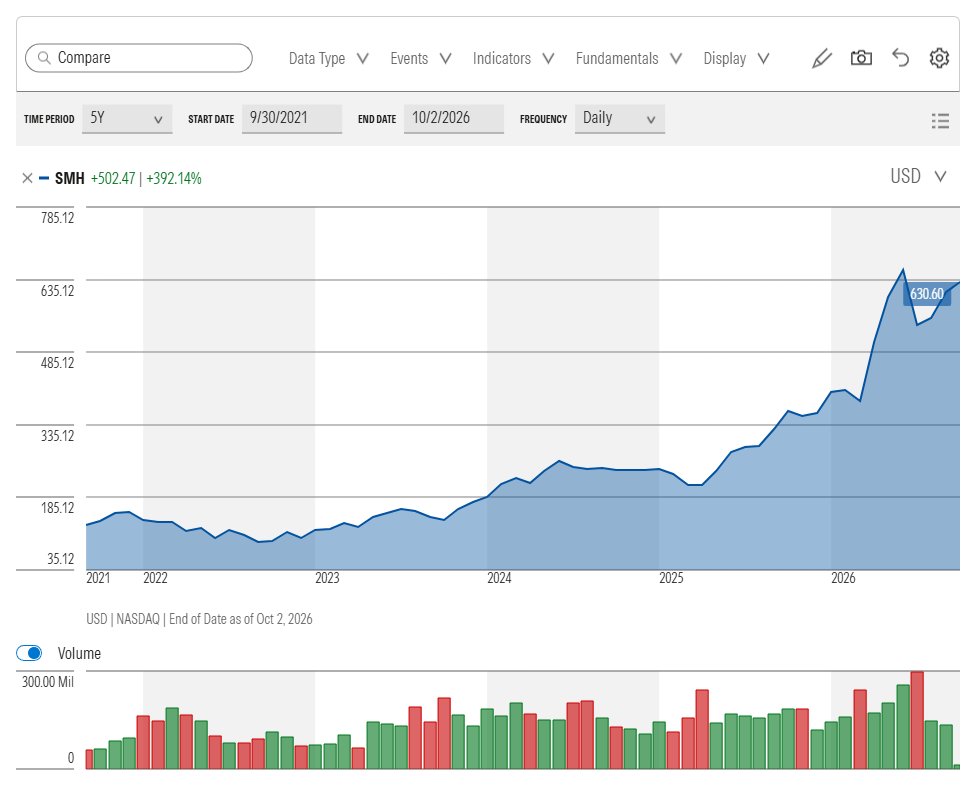
Semiconductor performance has been extraordinary. VanEck currently reports a 10-year annualized total return of 34.4% for $SMH, meaning roughly 19X your money over 10 years. Interestingly, global semiconductor industry revenue itself grew nowhere near 34% annually: worldwide semiconductor sales went from about $335B in 2015 to $796B in 2025, only about 9% CAGR. This means that most of the extraordinary return came from what happened on top of industry revenue growth. Let's look at the most important drivers. * Structural semiconductor demand growth. Cloud, smartphones, data centers, AI, networking, autos, industrial automation * AI / accelerated computing. Huge increase in semiconductor value per server * Profit/margin expansion. Revenue shifted toward extremely high-margin advanced chips * Winner concentration. NVDA, TSMC, AVGO, AMD, ASML, etc. increasingly dominate semi ETFs such as SMH * Industry consolidation/moats. Oligopolies formed in GPUs, lithography, foundry, EDA, equipment * Valuation rerating. Semiconductors moved from “cyclical commodity” perception toward “critical infrastructure/growth” * Index construction. SMH naturally allocates more capital to successful large companies * Operating leverage. Earnings grew substantially faster than semiconductor industry sales Fundamental driver is that the world started consuming dramatically more semiconductor value In the 1990s, semiconductor demand was mainly PCs. Then came smartphones. Then cloud computing. Then data centers. Then automotive electronics. And now AI. The critical point is that semiconductor content per system has increased dramatically. A conventional corporate server might contain perhaps a few thousand dollars of semiconductor content. An AI server/rack can contain tens or hundreds of thousands of dollars of GPUs, HBM, networking chips and supporting silicon. That means semiconductor demand increasingly behaves like: units × semiconductor content per unit rather than merely the number of computers or phones sold. SIA says global semiconductor sales increased from $335B in 2015 to almost $800B in 2025, while AI, autonomous driving, connectivity and other applications remain major structural demand drivers. Semiconductor Industry Association The biggest story is the shift toward very high-value chips The semiconductor industry did not merely double in size. The mix became much better. Compare an ordinary microcontroller or analog chip selling for a few dollars with an advanced AI accelerator selling for tens of thousands of dollars. AI has pushed enormous amounts of industry revenue toward GPU / accelerators → HBM → advanced foundry → advanced packaging → networking → semiconductor equipment These happen to be areas where companies have extraordinary competitive positions. This creates much more profit per dollar of industry revenue. NVIDIA alone explains a surprisingly large part of the story NVIDIA illustrates what happened almost perfectly. Fiscal 2016: Revenue: $5.0B Net income: $614M Gross margin: 56.1% Fiscal 2026: Revenue: $215.9B Net income: $120.1B Gross margin: 71.1% That corresponds roughly to Revenue 46% CAGR and Net income 70% CAGR over those ten years. And NVIDIA is currently approximately 19% of SMH. So the ETF benefited massively from one of the greatest earnings-compounding stories in stock-market history. Semiconductor industry structure became extraordinarily attractive One of the most important changes has been specialization. Twenty-five years ago semiconductor companies commonly designed and manufactured their own chips. Today the ecosystem looks more like: $NVDA / $AMD / $AVGO ↓ design $TSMC ↓ manufacturing $ASML / $AMAT / $LRCX / $KLAC ↓ manufacturing equipment $CDNS / $SNPS ↓ chip-design software Each layer has become increasingly concentrated. We essentially have several near-monopolies or oligopolies: NVIDIA - AI accelerators TSMC - leading-edge foundry ASML - EUV lithography Cadence/Synopsys - EDA software KLA - process control Lam/Applied Materials - key fabrication equipment These are much better economics than the old perception of semiconductors as essentially a commodity manufacturing industry. High barriers to entry allow high ROIC → high margins → huge FCF → reinvestment → technological lead → even higher barriers. That feedback loop has been extremely powerful. Earnings grew much faster than semiconductor industry revenue This is the most important mathematical explanation. Semiconductor industry revenue growing 9%. Simultaneously: * market share shifts toward highly profitable companies, * gross margins increase, * operating expenses grow slower than revenue, * share counts fall through buybacks, EPS might grow 15–20%+. Then add valuation multiple expansion and you can reach much larger shareholder returns. Very roughly: Stock return ≈ revenue growth + margin expansion + capital allocation + multiple change Semi experienced favorable conditions across essentially all four simultaneously. The industry went from "cyclical hardware" to "strategic infrastructure" This also caused a major valuation rerating. Around 2015–2016, investors still viewed many semiconductor companies primarily as cyclical businesses dependent on PCs and smartphones. Today the market increasingly treats the leading companies as essential infrastructure for AI, cloud computing, defense, automation and the digital economy. That distinction matters enormously. A company growing EPS 15% that trades at 15X earnings becoming a company trading at 30X earnings produces a 100% return even before any earnings growth. Some of the 10-year SMH performance therefore reflects multiple expansion, not merely fundamental earnings growth. At the same time, ETFs like $SMH's methodology often creates a subtle "winner effect" SMH is not a static portfolio of the semiconductor companies that existed in 2016. Its underlying index specifically targets the largest and most liquid semiconductor companies, and is periodically reconstituted. Consequently, companies that become enormous get larger representation; companies that stagnate shrink in relative importance; companies that disappear or become irrelevant eventually leave the index. Today the top holdings include approximately: NVIDIA 19.3% TSMC 9.2% AMD 5.5% Broadcom 5.0% Micron 5.0% So just those five account for roughly 44% of the ETF. This means SMH has effectively allowed semiconductor winners to become very large positions. It is somewhat similar to the mechanism that makes capitalization-weighted indices surprisingly powerful over long periods. You don't need to know which company will become the winner beforehand. The index gradually lets the winner become larger. AI has turbocharged what was already a strong trend This is important when interpreting the 10-year CAGR. SMH's current trailing returns are: 1 year: 87% 3-year CAGR: 62% 5-year CAGR: 37% 10-year CAGR: 34% VanEck So the 34% 10-year figure is being pulled upward substantially by the extraordinary 2023–2026 AI boom. The semiconductor industry was already a strong performer before generative AI, but the last three years have been unusually powerful. Having said this, we should not extrapolate 34% CAGR forward. Another 34% CAGR for the next decade would require much more than semiconductor TAM growth. At today's starting valuations and already-elevated margins, repeating the past decade becomes mathematically much harder.
$JNJ had risen so fast YTD that it's now part of $SPMO momentum ETF. There are several identifiable reasons. J&J has repeatedly raised its operating outlook. Q1 sales grew 9.9%, with operational growth of 6.4%, and management raised 2026 guidance. Then Q2 sales increased another 6.6% to 25.3B, with adjusted EPS of $2.90 versus about $2.85 expected. Management raised expected 2026 sales to about 101.1B and, before subsequent acquisition-related charges, raised adjusted EPS guidance to about $11.68. The market is now becoming more comfortable with the Stelara patent cliff. This was probably the biggest fundamental concern around JNJ. Stelara sales fell more than 55% in Q2, yet the overall pharmaceutical business still grew because newer products are compensating surprisingly well. In particular, J&J has very strong growth from: Tremfya — Q2 sales jumped about 73% to 2.0B Darzalex Carvykti Tecvayli Rybrevant/Lazcluze Spravato Caplyta Innovative Medicine operational sales still grew 6.8% in Q2 despite Stelara being a ~7.6 percentage-point drag. That is a powerful signal that JNJ may be able to grow through the patent cliff rather than entering the type of post-patent stagnation investors feared. The talc litigation overhang has fallen dramatically. This may be the biggest reason for the valuation multiple rerating rather than the earnings improvement itself. On July 27, J&J announced an agreement aimed at resolving roughly 76,000 remaining ovarian-talc claims, with an estimated cost around 5.5B. The agreement requires participation by at least 95% of the relevant claimants, so it isn't completely finished, but it potentially removes a legal uncertainty that had hung over JNJ for roughly a decade. That is important because the market previously had difficulty putting a number on the potential talc liability. Now investors can estimate the liability, even a multi-billion-dollar settlement can actually be positive for the stock because the uncertainty discount disappears. The pipeline increasingly looks capable of producing the next generation of blockbusters. One interesting example is Icotyde, J&J's oral psoriasis drug. A recent BofA analysis reportedly increased its estimate of Icotyde's potential peak psoriasis sales from $2.4B to $4.5B following a physician survey. The company also continues investing heavily through acquisitions and partnerships. In fact, J&J subsequently reduced its 2026 adjusted EPS forecast because the Firefly Bio acquisition and Sail Biomedicines partnership are expected to reduce 2026 EPS by about $0.64. Importantly, that's primarily investment/R&D-related dilution rather than deterioration of the existing businesses; J&J kept its revenue forecast essentially unchanged. Investors are rerating JNJ from "ex-growth pharma with litigation risk" toward "moderate-growth diversified healthcare". That's an important distinction. Earlier the investment case contained three big discounts: Stelara patent cliff + talc uncertainty + relatively weak growth. Increasingly the picture looks more like: Talc resolution + Stelara replacement drugs working + 5–7% underlying sales growth + strong pipeline. That's quite a different earnings-quality profile. There are still weaknesses though. MedTech is not firing on all cylinders: Q2 MedTech operational growth was only 3.6%, and Impella sales were weak following concerns raised by a UK study. We should not interpret the JNJ rise as merely investors hiding in a defensive stock. There has been a genuine improvement in the company's risk/growth profile. The next important checkpoint is Q3 earnings on October 13, 2026.

Kent @KentEkasak
2K Followers 3K Following Human | Investor & Philanthropist | Ficus Fund | @Money_disruptor | Capital Preservation & Home Run | Positive Compounding
Bhaskar Dutt @BDuttSG
22 Followers 448 Following
SANKARGURU CIVIL @sankarguru353
42 Followers 174 Following
SigroResearch @SigroResearch
116 Followers 300 Following Free research on AI infrastructure, semiconductors and rates, checked against the filings. Not financial advice.
O.Aydin @MinimaMoralla
131 Followers 2K Following

diogo @daaunon
57 Followers 264 Following
KO-LI YANG @ezbartender
11 Followers 285 Following
stockNoBear @stockAIBear
511 Followers 1K Following 消息比K线快一步,情绪比财报先到。 Bull or Bear, I'm here | 美股 · A股 · 科技财经 每天3分钟,看懂市场在赌什么 关注我,行情不迷路
Nav Dhand @nav_dhand
2K Followers 2K Following Long-term investor in quality, value and dividends. Stock breakdowns, data studies, and lessons from my wins and mistakes. Building @stockoscope. NFA


Gabriel Luciao @LucianG75
10 Followers 30 Following


Snowballer Dev @snowballer_dev
311 Followers 5K Following Software developer and buy & hold investor. Holding a very pragmatic view for all. The world is complex so it demands rationality, scepticism but empathy
a @AdamMit87005106
12 Followers 327 Following
NevEr Better @NevErBetter101
36 Followers 57 Following
Big Sal @romanello_sal
13 Followers 436 Following
Investments Ideas Fro... @Queteim76792057
231 Followers 486 Following Learning, developing and promoting Independent Financial Advisors Thesis and Investment Ideas
Mithil @drmithil1
304 Followers 2K Following
Mike Holley 🇨🇦 @tallmikeholley
1K Followers 3K Following Running Spartan & Hyrox races🏃♂️Hockey & Lifting 🏋️I love time in Nature 🏕️ Serving homeowners in beautiful British Columbia 🇨🇦
T @MarceloChartier
55 Followers 278 Following
Miguel Vargas @miguelvarg
360 Followers 966 Following MBA,Ingeniero Civil en Minas, Militante RN, Emprendedor, Inversionista, Poeta, ColoColino, Pircano y Padre de Leonor y Franco ❤️🐝🎈
Moyen Pierre @Pierretwitte64
58 Followers 449 Following
Nick E @truthseeker6d
40 Followers 164 Following
Hoa Trinh @HoaTrin96892670
137 Followers 2K Following All about Capital Markets, Observe Opportunities and Risks, Family Office, Momentum-Value, hier rein privat
ClickingButtons @Dimwit74
44 Followers 93 Following
Boyang Li @BoyangLi_
43 Followers 254 Following
📈J.J. Gonzalez💻 @Gestiprudent
33K Followers 2K Following Asesor del Fondo Gestivalue Capital donde invierto mi capital desde mayo23. Cofundador Formador en BolsaZone. CFO de multinacionales. Auditor Big4. EFPA.
PKreader @PKreader8877
83 Followers 800 Following
Vierecke @Vierecke22
33 Followers 171 Following
Shant @Shant851326
87 Followers 746 Following
Steven Martin @Colosteve2000
919 Followers 379 Following AI, semiconductor & quantum research for investors Intel | Foundry | Memory | Advanced Packaging Founder, Roaring Fork Research
IS @Sen60000
53 Followers 1K Following
. @a_arshavin23
77 Followers 301 Following
CW @CW1707
16 Followers 204 Following
hoke @hokemaguy
74 Followers 553 Following
aonghusom @aonghusom
49 Followers 1K Following
M Nichols @marlonnichols
622 Followers 1K Following Individual Investor, Strategic Risk-Taker, Optimist and Business Strategist
Michael Ryan @michaelhoos_97
18 Followers 112 Following
Paul Jackisch @PaulusOptimus1
115 Followers 701 Following
Gameboycolor @PPhijarnwanit
109 Followers 668 Following
FS @rvn0203
12 Followers 75 Following
Danny @nynyusa
64 Followers 2K Following
ChristopherMoule @moule
138 Followers 868 Following
BTR forecast @Brikka_trading
4K Followers 1K Following Technical Analyst | Practical Elliottican 🌊 Structures • Key levels | Core human behaviors driving markets haven't changed – price reflects that. NFA | DYOR ⚠️
Varinder Bansal 🇮�... @vbomkara
457K Followers 2K Following Founder @OmkaraCap & @TheBoringAMC Believer in India's future. Passionate about equities, businesses & creating wealth the RIGHT way.
Hatim's Shorts @HatimsShorts
1K Followers 6 Following Creator | 670K YouTube · 530 TikTok · 290K IG · 240K FB | Viral Videos & AI Content Creator

Pulte @pulte
3.0M Followers 1K Following Director of Federal Housing of the United States and former Acting Director of National Intelligence of the United States
U.S. Federal Housing ... @FHFA
43K Followers 1K Following U.S. Federal Housing (FHFA) is an independent federal regulator overseeing the housing finance market. Privacy policy: https://t.co/SuZhbTeRJw
Сырный @Graf_CbIP
6K Followers 942 Following пишу в Твиттер по принуждению, сам бы ни за какие коврижки (но это не точно )...
Polrad Mapping @polrad_mapping_
753 Followers 60 Following German mapper, reporting neutrally on the situation in Ukraine, sometimes commenting, following doesn't mean support. "The pen is mightier than the sword"
BGaming Official @BGamingO
7K Followers 222 Following BGaming is a player-centric game developer, publisher, and trusted partner offering 250+ engaging games and beyond for 3,000+ operators and ∞ players worldwide.

Yanika Krasnivska @krasnivska
8K Followers 4K Following Ukrainian from Donetsk. Survived occupation in Kyiv region. Business trips, poetry, trade unions & recovery ❤️ PayPal: [email protected]
Intolerant lactose �... @mmm_margosha
394 Followers 244 Following mama ain’t raise no bitch. 🩷💜💙 🐸 учитель иностранных языков/лингвист/неоконченный медстудент/current computational linguistics студент
Соболь Любо... @SobolLubov
440K Followers 170 Following Russian opposition politician, lawyer. To follow in English: @SobolLyubovEn

WW2 The Eastern Front @ShoahUkraine
109K Followers 101 Following Special Tasks ☭ https://t.co/ohF86XAmvW
Terror Calendar @TerrorCalendar
2K Followers 78 Following We remember the victims and perpetrators of Stalinist terror, one day at a time. #OTD by @aksinia00447 and @tupacisoverit
Talena 🇺🇦 ꑭ @TalenaUkraine
7K Followers 48 Following 🇺🇦 Ukrainian, live in Ukraine. I write about my country — culture, history, people. ⬇️ Blogs, music, games and Ukrainian language lessons.

Vitalii «Donetsk» O... @Vit_Ovchar
17K Followers 2K Following Ukrainian army soldier, active citizen. NATO enthusiast from Donetsk. (Сімон Візенталь регіонального масштабу 🫡 )
Wedekind Research @RichardWedekin1
6K Followers 500 Following Börsenspekulant 📈📉 • Investment Research 📑🔎 — Not Financial Advice / Keine Anlageberatung —
Morning Brew ☕️ @MorningBrew
595K Followers 2K Following Everything you need to know about the world of business and the business of the world. ☕️
John Galt @AtlasShrug1
8K Followers 740 Following Retired HF PM. Sarcasm. Satire. Opinions only. Mkt history, psychology, cycles. Not financial advice. DYOR. I may buy/sell any stock any time w/o notice.
Eastern Bloc Visuals @eastblocvisuals
40K Followers 38 Following A visual journey through central and eastern Europe from 1947 to 1991.
Yellowbrick Investing @joinyellowbrick
31K Followers 99 Following The best source of market-beating stock pitches in the world at https://t.co/TnE1hsXWqj
Caolan @CaolanReports
158K Followers 2K Following Name is pronounced Kay-lin | ☘️ Frontline Reporter in Ukraine | Director of Under Deadly Skies On Apple TV | Won 22 Film Awards | Co-Founder of Byline TV
CDRomance @CDRomance_Spike
16K Followers 167 Following A retro gaming community featuring ROM hacks, fan translations and hidden gems! #NewEnglishPatch
Ren @ren_stocks
53K Followers 108 Following Investing into the AI buildout ⚡️ 500% YTD Head of AI | Product Manager #79 Bestseller on Substack Finance. Subscribe on X or on Substack to get Discord access
SynMax Energy @SynMaxEnergy
4K Followers 678 Following @SynMaxEnergy is an intelligence company delivering AI-driven insights across energy markets, uncovering signals across the energy value chain.
🔋Eos Energy Enterp... @PoweredByEos
14K Followers 1K Following Eos is reimagining energy storage to enable a future of limitless energy—energy so abundant and reliable that it can fuel humanity’s limitless potential.
Bitdeer AI @Bitdeer_AI
2K Followers 29 Following One-Stop Neocloud with AI solutions: Empower AI Growth Innovation NASDAQ: $BTDR
CleanSpark Inc. @CleanSpark_Inc
36K Followers 830 Following Data Center Developer for AI, HPC and Bitcoin /// Nasdaq: $CLSK /// Power Under Contract: 1.8 GW /// BTC Holdings: 13,703

Pick Me Daily @PickMeDaily
22K Followers 309 Following Her gün yeni bir Pick Me vakası 🎀 yeni sayfa Takip edin ♡︎ hesap satılık iletişim dm
THE GAP FATHER @HunterAllen4
21K Followers 2K Following Stock Screener| OFF THE RADAR DIPS | Finding the next 10x | Vance Roasts included large cap pivots & high spec SMIDS moves. NFA. 📈🚀TN- Go Vols
Paradis @ParadisLabs
80K Followers 151 Following AI & tech investment research. No financial advice.
Noble Capital Markets @NobleCapMkts
1K Followers 1K Following A research-driven investment bank focused on small cap, emerging growth companies. Member of FINRA|SIPC|MSRB
Shankar Musunuri @drsmusunuri
714 Followers 8 Following Advancing cures for blindness as Chairman, CEO and Co-Founder of @Ocugen
Ocugen @Ocugen
65K Followers 211 Following Approaching healthcare innovation with ingenuity, passion and courage to create new solutions to difficult medical challenges. Guidelines: https://t.co/SYzUIr1zPD
Токарь-скви... @Pablique_S
2K Followers 1K Following Камень внутри убийцы, трусливой холодной твари, однажды закончит биться, и миру покой подарит...
Павел Комар... @Rational_Answer
22K Followers 773 Following Пишу интересно про финансы и технологии здесь: https://t.co/yjvk1COChK
SOTA @sotaproject
8K Followers 156 Following Наверное, лучшее российское СМИ. Почта редакции: [email protected] telegram: https://t.co/A8MN1X46oo Англоязычный твиттер: https://t.co/JCBSoWBuSH
chad. @chad_ventures
25K Followers 204 Following Founder of @meridian_io | Technical Analyst covering Stocks, Crypto, Indices, Commodities & More Try my indicators, free for 7 days ➡ https://t.co/CfqnanHnGv
Fajasy @StableBread
3K Followers 374 Following https://t.co/FoWL95rtbn (guides, models, tools) | https://t.co/1ZVB9Zuyqa (EDGAR reader) | Write-ups on AI infra, rocks, spec sits, SaaS, new 52w lows 👇


Евгеша, да п... @Evgeshahorny
8K Followers 128 Following Чтоб понять меня, надо быть мной ну или хотя бы во мне!
Bram Van Genechten @BramVGenechten
3K Followers 310 Following Fundamental long-term investing in high quality companies. Visuals & numbers. Life wisdom. Health. Never investment advice, always do your own research.
Мухтар Абля... @ablyazovMK
2K Followers 309 Following Лидер оппозиционного движения «Демократический Выбор Казахстана», экс-министр энергетики, кандидат на пост Премьер-министра Казахстана.

Zorya Londonsk @ZoryaLondonsk
18K Followers 1K Following 🇺🇦 # 1 source for Ukrainian football in English 🇬🇧 1/3 of Ukraine + Football Podcast🎙 | AIPS Accredited ⚽️ | Founder: @andrewtodos | DM’s Open 📬
Retro Football Networ... @retrofootballnw
24K Followers 6K Following AKA Gary Cook. Daily retro football nostalgia, quizzes & clips. Home of Retro Football magazine. Issue 4 out now.
aleha_84 @84Aleha
93K Followers 133 Following Creating cozy #pixelart scenes Support: https://t.co/0ljK1B0uGG Downloads: https://t.co/ongSnAYUmF https://t.co/86iJ1HE9tkTrends for United States
You might like